Benchmarks
This section demonstrates the new simplified method by applying it to predict indoor airflows of:
-
Natural convection
-
Forced convection
-
Mixed convection
They represent the basic elements of room airflows. For simplicity, these cases are selected to demonstrate the new simplified model.
1. Natural Convection
For natural convection, the experimental data of Olson and Glicksman [17] as shown in Figure 1 will be used.
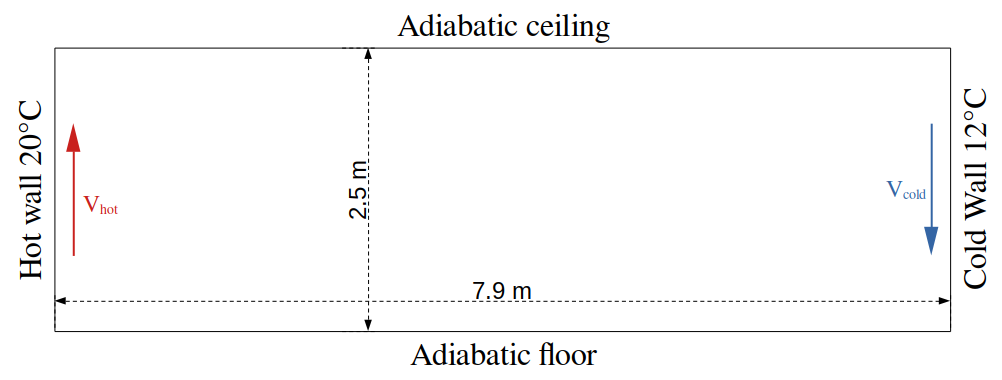
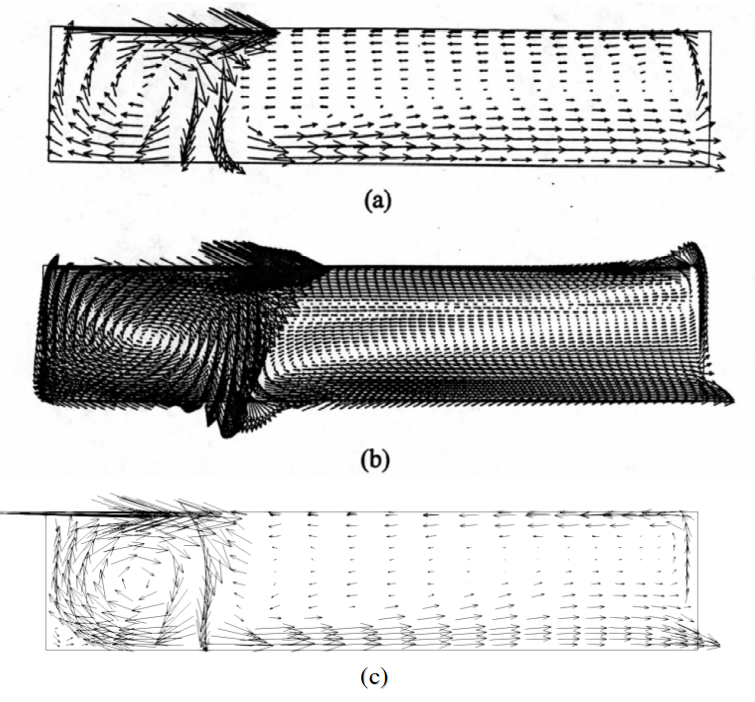
Figure 2 compares the airflow patterns obtained by the simplified model and Feel++, Chen and Xu results, the CFD method with Lam-Bremhorst [Lam-Bre] k-ε model, and smoke visualization. The simplified model predicts the main stream reasonably well although the boundary layers of the ceiling and floor are thicker. Note that both simplified models as well as the CFD model predicts the observed reversed flow found beneath the ceiling layer and above the floor layer. The layer thickness are not correct for the simplified models due to the large cell size used. However, we found only the Lam-Bremhorst model could predict the reversed flow when Chen and Xu tested quite a few eddy-viscosity models.
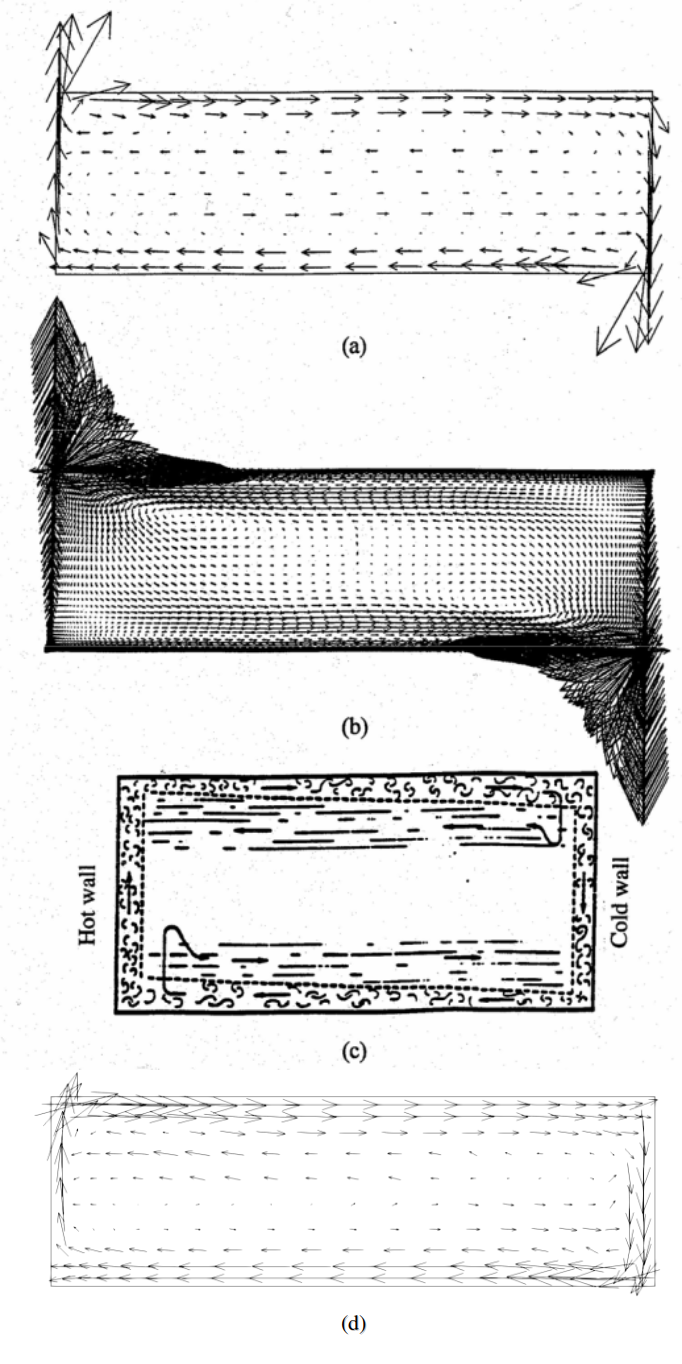
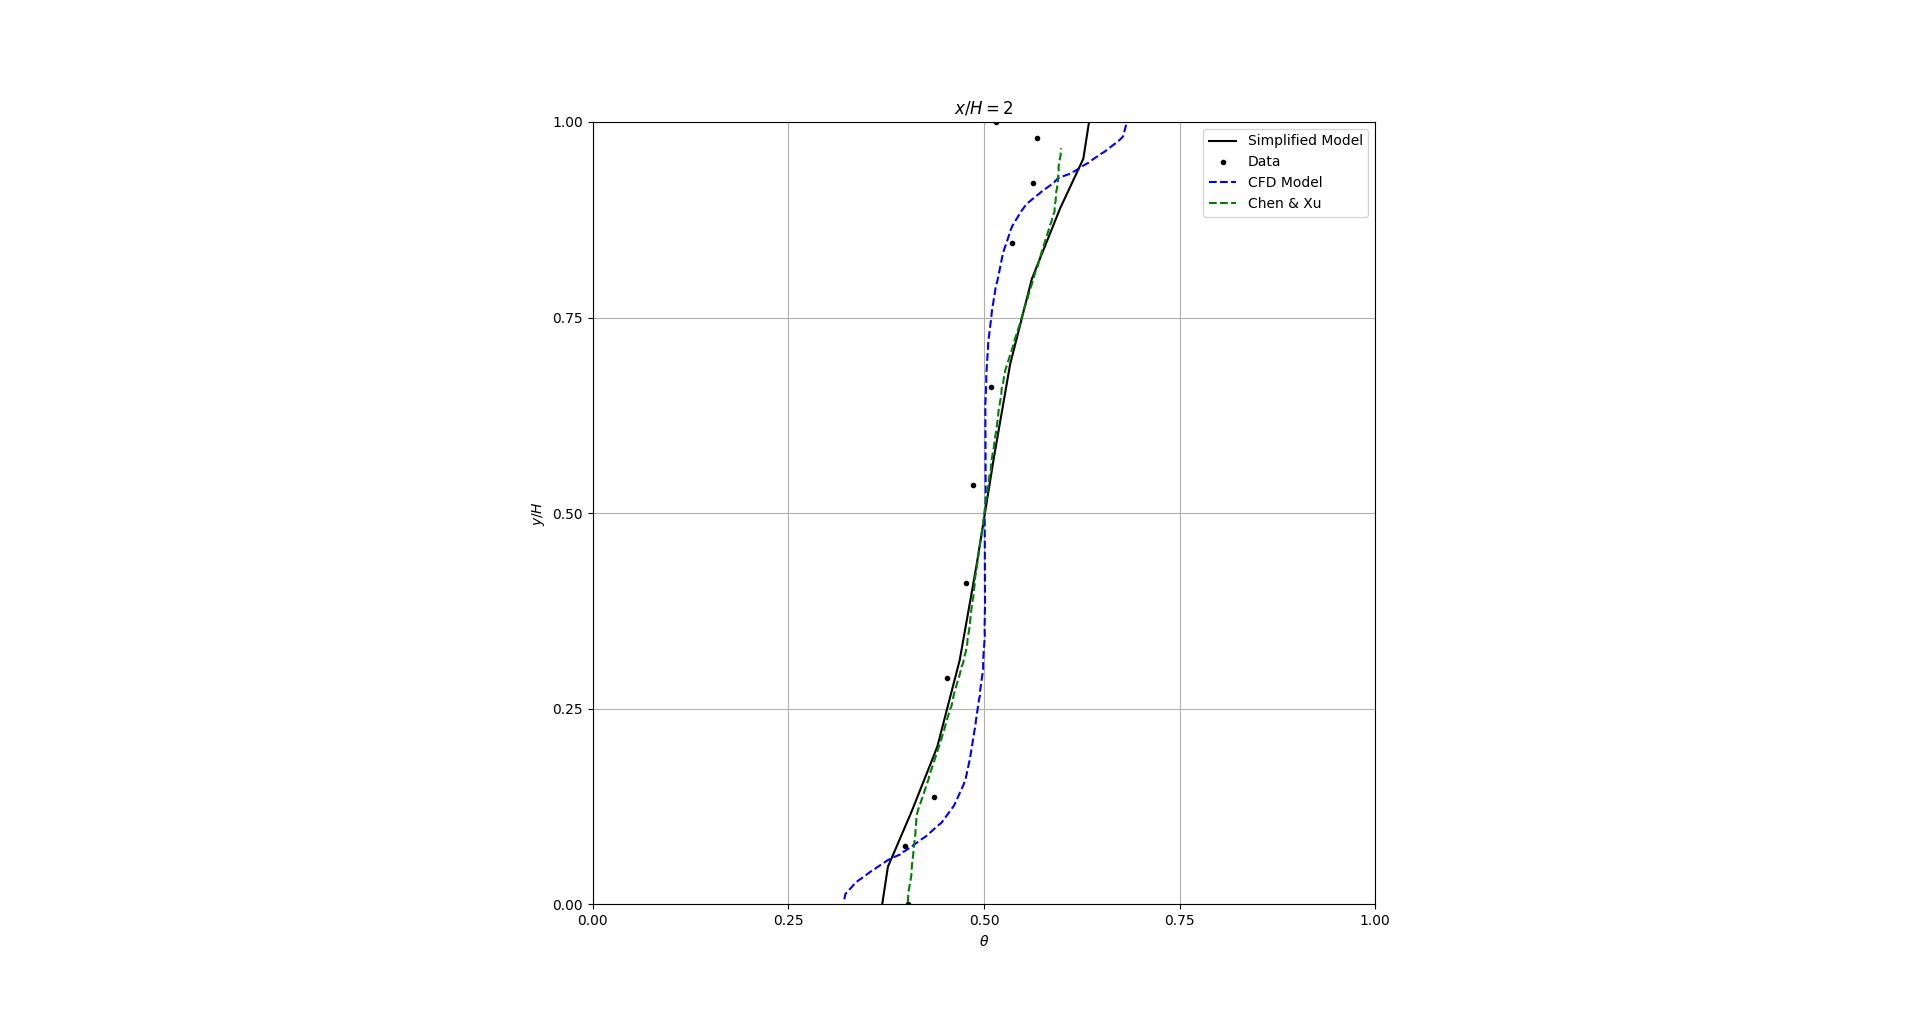
Figure 3 presents the dimensionless temperature profiles in the vertical center line. Chen and Xu simplified model predicts the temperature profile better than the other models whereas the simplified model with Feel++ predicts the temperature profile better than CFD model in this particular case.
2. Forced Advection
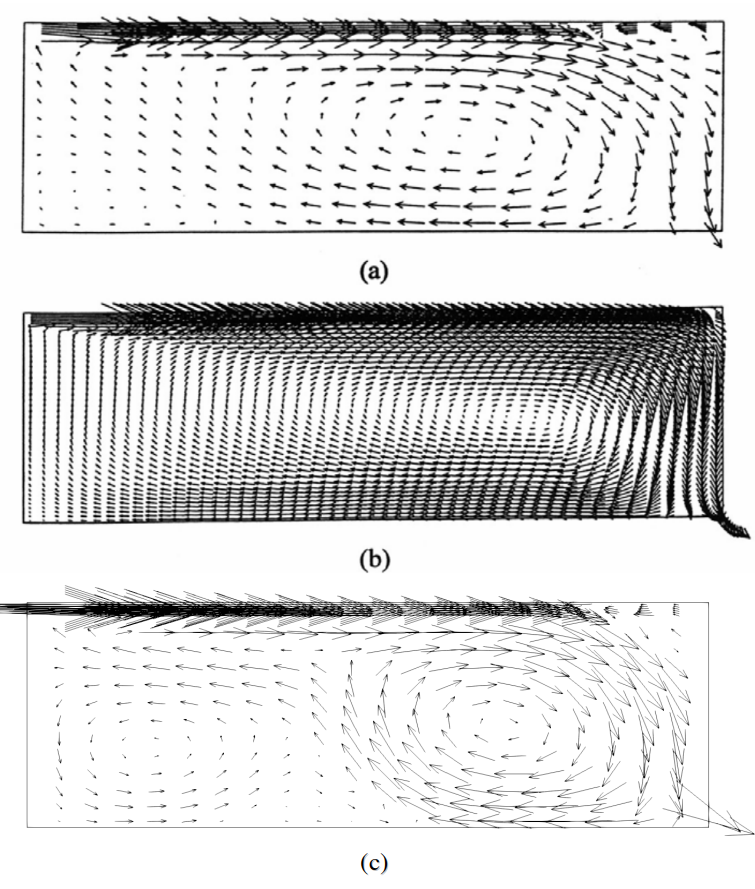
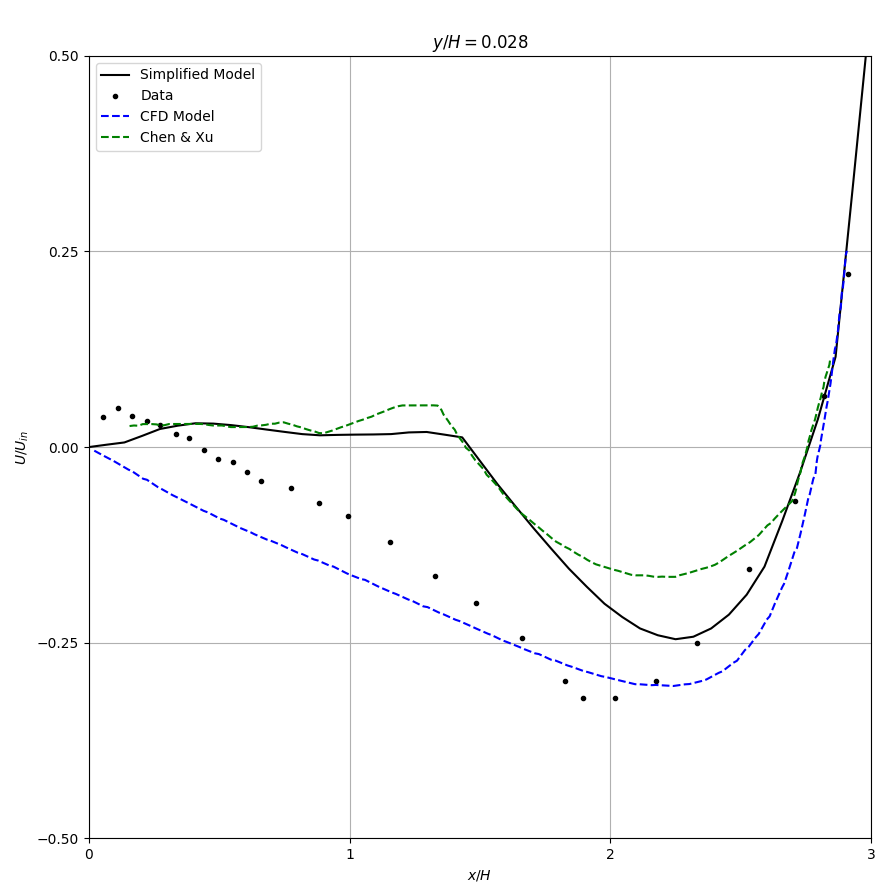
The forced convection case uses the experimental data from Restivo [19] shown in Figure 4. The Reynolds number is 5000 based on bulk supply velocity and the height of air supply outlet. The air supply outlet h=0.056×H, and exhaust inlet h’=0.16×H.
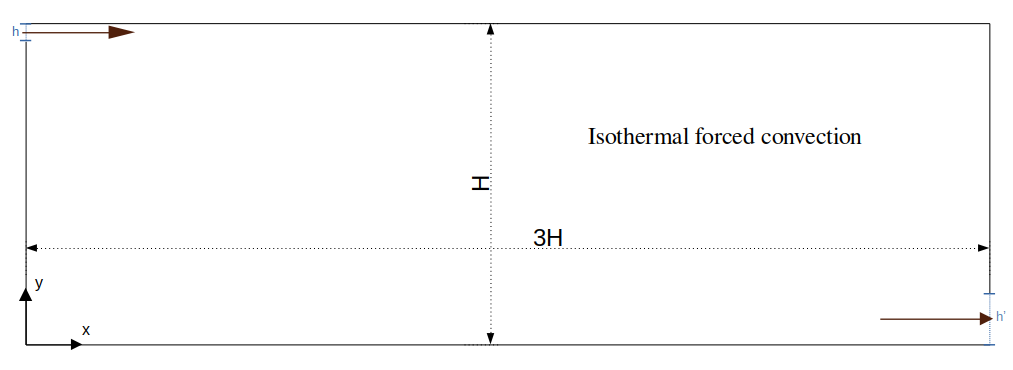
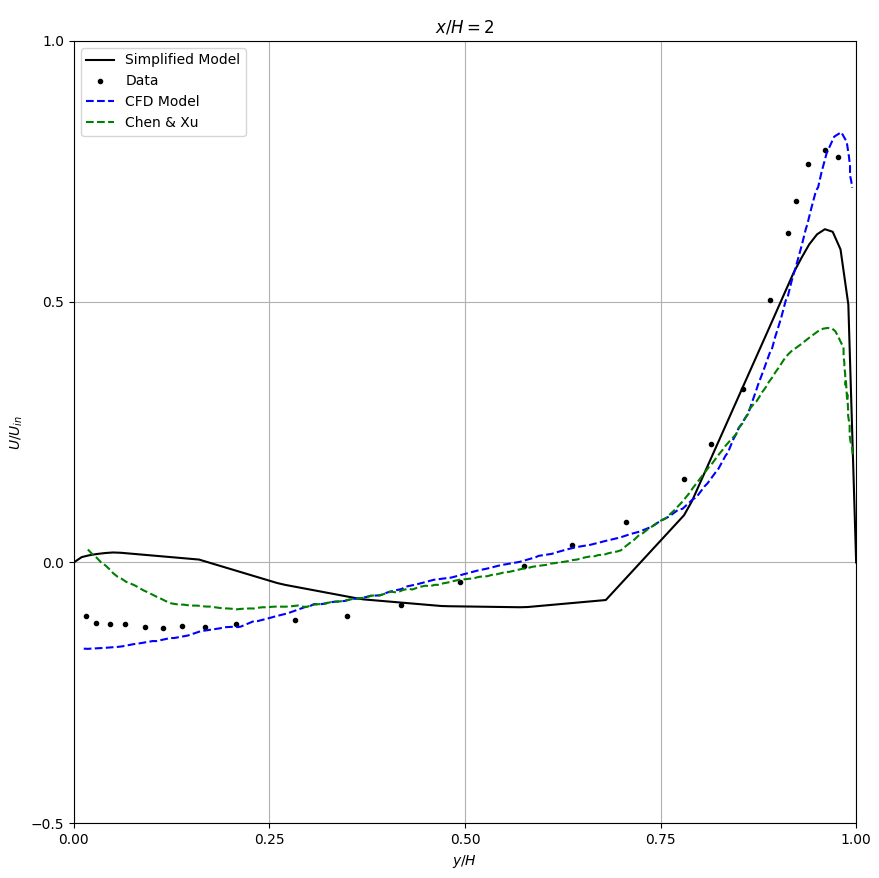
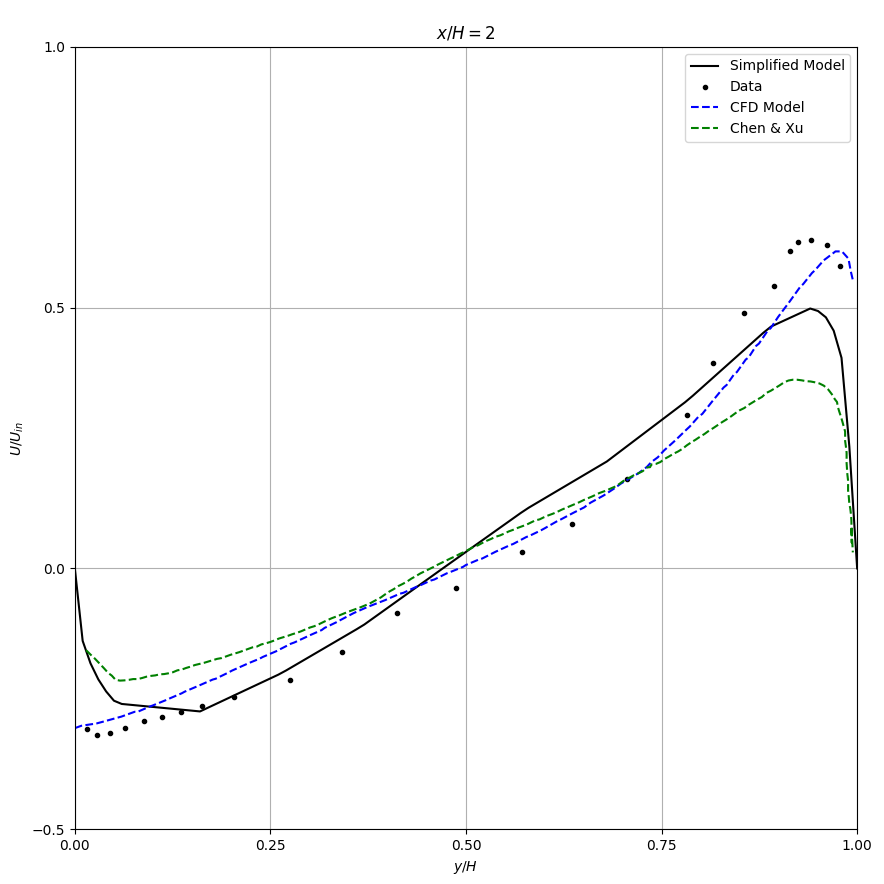
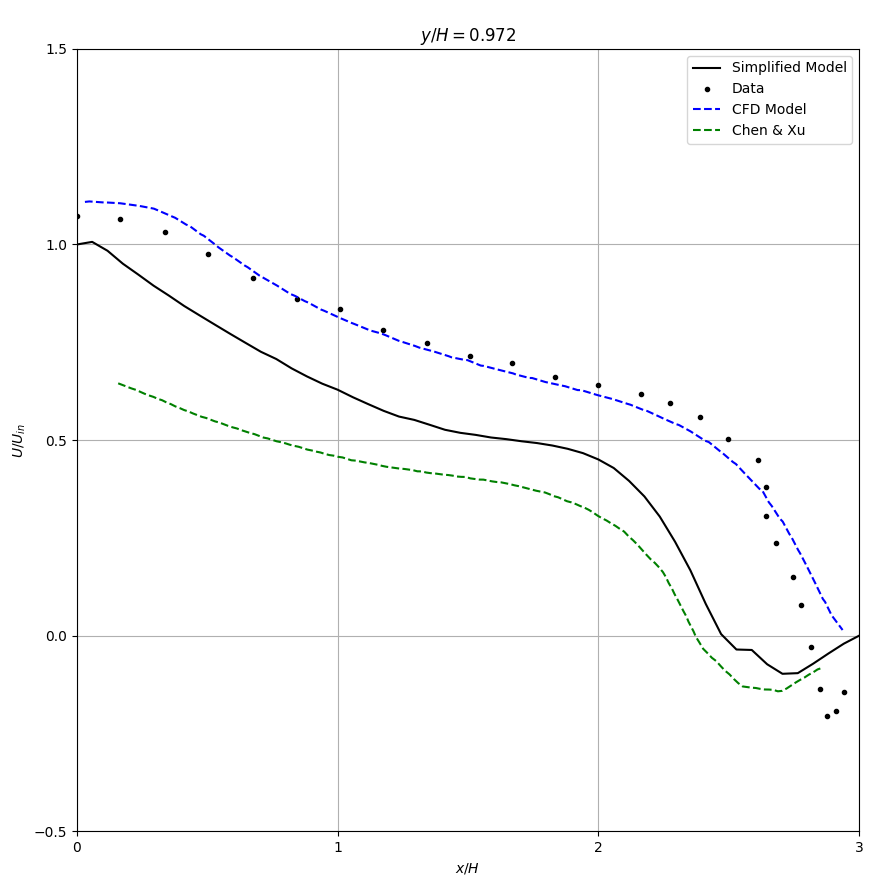
Figure 5 compares the airflow patterns by the simplified models and the CFD method with standard k-ε model (Launder and Spalding [20]). The computed velocity profiles are compared in Table 1 with experimental data in two vertical sections \(x/H = 1\) and \(x/H = 2\) respectively and two horizontal sections, \(y/H = 0.972\) (through the air supply outlet) and \(y/H = 0.028\) (through the air exhaust inlet). The results of both simplified models show a jet decay that is too strong. Hence, the primary flow near the ceiling and the return flow near the floor are smaller than the data. In this case, the k-ε model predicts a satisfactory result. Nevertheless, the simplified models could predict the second recirculation on the upper right corner, though the recirculation is too large. However, the k-ε model fails to predict the recirculation.
|
|
|
|
3. Mixed Advection
The mixed convection case uses the experimental data from Schwenke [21]. The case is similar to the forced convection but the room length is 4.7×H and the height of the air supply outlet h=0.025×H. The right wall is heated but the ceiling and floor are adiabatic. Schwenke conducted a series measurements with different Archimedes numbers [23], \(\mathrm{Ar}\), ranging from 0.001 to 0.02.
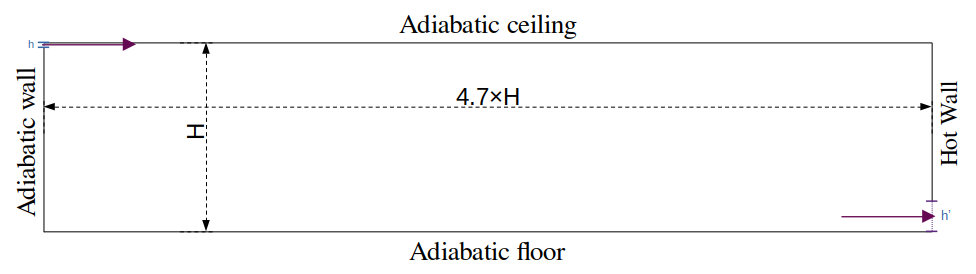
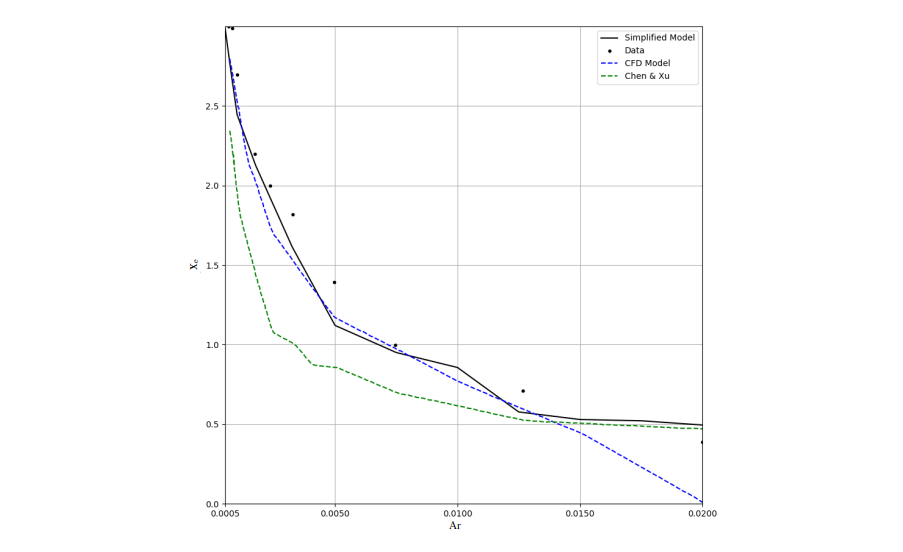
Figure 7 compares the computed airflow pattern by the simplified methods with that by the CFD method with the standard k-ε model. The three results are similar. The airflow pattern is very sensitive to the \(\mathrm{Ar}\). The computed and measured penetration depths, \(x_e\) , versus different \(\mathrm{Ar}\) numbers are compared in Figure 8. The \(x_e\) is the horizontal distance of air movement along the ceiling before it falls to the floor. The simplified model with Feel++ works the best whilst Chen and Xu model works better in high \(\mathrm{Ar}\) but the CFD model better in low \(\mathrm{Ar}\).
References
-
[4] Chen Qingyan, Xu Weiran. Simplified Method for Indoor Airflow Simulation. Energy and Building, Massachusetts Institute of Technology, 1997.
-
[17] Olson, D.A. and Glicksman, L.R. 1991. Transient natural convection in enclosures at high Rayleigh number, ASME J. Heat Transfer , 113, 635-642.
-
[18] Lam, C.K.G. and Bremhorst, K. 1981. A modified form of the k-ε model for predicting wall turbulence, ASME J. Fluid Engineering , 103, 456-460.
-
[19] Restivo, A. 1979. Turbulent Flow in Ventilated Rooms , Ph.D. Thesis, University of London, U.K.
-
[20] Launder, B.E. and Spalding, D.B. 1974. The numerical computation of turbulent flows, Comp. Meth. Appl. Mech. Energy, 3, 269-289.
-
[21] Schwenke, H. 1975. Über das Verhalten elener horizontaler Zuluftstrahlen im begrenzten Raum, Luft- und Kaltetechnik , 5, 241-246.
-
[22] Wikipedia - «Feel++»