Indoor Air Quality (IAQ)
1. Introduction to IAQ
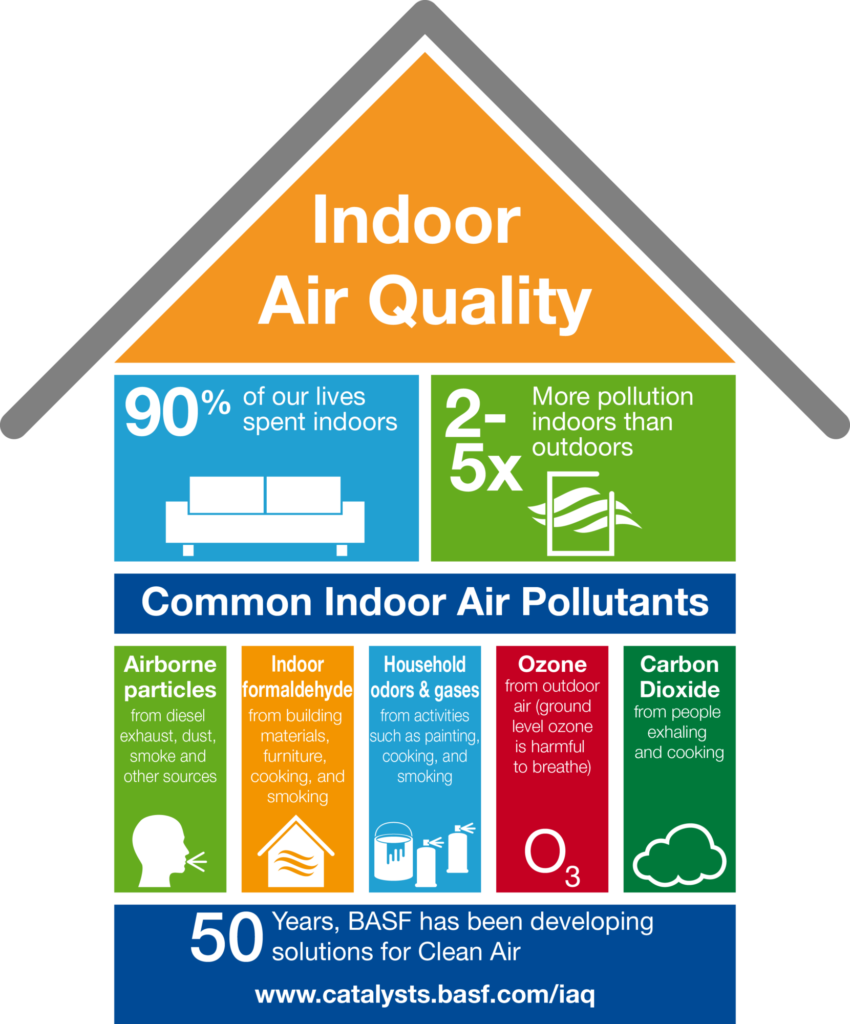
Our expectations are high for indoor environments where we spend most of our time. According to the WHO, we spend more than 90% of our times in indoor spaces: homes, work offices, public places, transport, in which we can be exposed to many pollutants.
Above all, we expect that these environments will not threaten our well-being and we try to lower risks for injury and damage to our health. One long neglected aspect of indoor environments is the quality of the air and whether inadequate indoor air quality can actually pose a threat to health.
Yet, we are wondering what is exactly indoor air pollution and why do we have to improve indoor air quality?
Firstly let’s give the definition of pollutants.
The indoor air pollutants are any pollutant present in the air of closed environments regardless of its source, whether endogenous to this environment and its occupants, or external to it (outdoor air pollution, etc.).
Here below (Figure 1) we illustrate a summary of different sources of indoor air pollution with some key figures. Some of them could be remarkable such as having 5 times more air pollution inside our house than outside of it. These surprising facts we often do not necessarily think about. However, we will show their significance later on.
The principal indoor air pollutants can be divided into three categories:
-
Chemical pollutants: volatile organic compounds (VOCs), nitrogen oxides (NOx), carbon monoxide (CO), polycyclic aromatic hydrocarbons (PAHs), etc.
-
Biological contaminants: moulds, allergens from mites, pets, pollens etc.
-
Particles and fibers: asbestos, artificial mineral fibers, inert particles, etc.
These pollutants emanate from a range of sources that we detail in the next subsection.
Indoor air pollution has become a more pressing concern in recent years due to the construction of more energy-efficient homes. These properties tend to be relatively airtight, meaning that the air inside can quickly become stagnant and pollutant levels rapidly rise.
2. Indoor air pollutants sources
There are many sources that can be responsible for indoor air pollution, some of which are recognisable due to their odor, but many of them remain unnoticed.
|
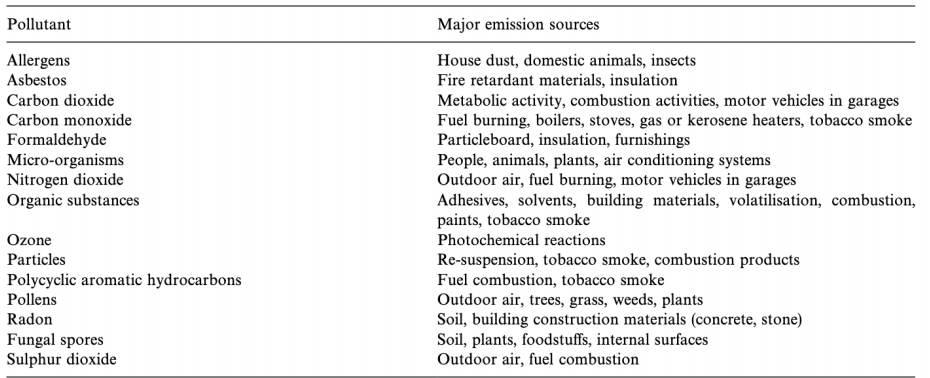
Here we itemize some of most widespread indoor air pollution sources in residential buildings.
Mould/Mold(US)
Mold is a form of fungus which grows from spores that latch onto damp areas in buildings. They are considered to be microbes and cause biodegradation of natural materials. Moulds can grow on many types of surface, most common during the winter months and in more humid climates. Mold in the home can usually be found in damp, dark or steamy areas. Moreover, daily home exposure, may be particularly harmful to human’s health and cause many different symptoms, mainly allergic reactions and respiratory problems.
Tobacco Smoke
A major cause of indoor air pollution, environmental tobacco smoke caused over 75.000 deaths in France in 2015. The inhalation of cigarette smoke is particularly harmful to children, increasing the risk of sudden infant death syndrome (SIDS), severe asthma and respiratory infections.
Moreover, cigarette smoke contains at least 70 carcinogens, chemicals that have been proven to cause cancers with over 45.000 deaths in 2015. These chemicals can cause illnesses such as chronic obstructive pulmonary disease (more then 17.000 deaths) and other cardiovascular diseases which lead to heart attacks, as well as other serious complications.
Household Products
Many day-to-day products which are present in almost every home and we use very often can cause indoor air pollution. Some examples of this products are:
-
Cleaning agents and disinfectants,
-
Paints,
-
Glues and solvents,
-
Personal care products,
-
Air fresheners,
-
Candles.
VOCs emitted by these products can cause eye, nose or throat irritation, headaches, nausea, organ damage, and even cancer in some extreme cases.
3. Effects of nefarious IAQ
Hereafter, we are wondering about the consequences of a polluted indoor air. The likelihood that an individual will become ill depends upon factors such as the contaminant concentration, individual’s sensitivity to the contaminant, the current state of their physical and psychological health and the duration and the frequency of exposure. The quality of the air breathed can have effects on comfort and health, from simple discomfort (drowsiness, eye and skin irritation, lost productivity at work) to the appearance or aggravation of pathologies: respiratory allergies, asthma, cancer, fatal or disabling poisoning, etc. Even more consequently, according to the WHO(2007), in the year 2000, over 1.5 million deaths were caused by indoor air pollution.
Sick Building Syndrome (SBS)
The divers symptoms and illnesses most often referred to the phenomenon, has became as SBS (sick building syndrome), where the occupants of some buildings repeatedly describe a complex health complaints. Numerous outbreaks have been reported since the early 1970’s [Jones1999]. Building occupants complain of symptoms associated with acute discomfort,headache, eye, nose, or throat irritation, dry cough, dry or itchy skin, dizziness and nausea, difficulty in concentrating, fatigue and sensitivity to odors. The complaints may be localized in a particular room or zone, or may be widespread throughout the building.
In 1984 World Health Organization Committee report suggested that up to 30 percent of new and remodeled buildings worldwide may be the subject of excessive complaints related to IAQ. Often this condition is temporary, but some buildings have long-term problems. Frequently, problems result when a building is operated or maintained in a manner that is inconsistent with its original design or prescribed operating procedures. Moreover, SBS symptoms may have a greater impact on public health and cost to the economy due to lowered productivity of workers.
Causes of SBS [EPA1991]
In the following we cite causes of or contributing factors to sick building syndrome :
-
Inadequate ventilation. Since 70’s oil crisis, national energy conservation measures called for for a reduction in the amount of outdoor air provided for ventilation per occupant to save energy. Indeed, lower ventilation save energy but it was found to be inadequate to maintain the health and comfort of building occupants, and people started getting sick from buildings. Some years later, standards developing groups strike a balance between energy efficiency and adequate ventilation to prevent sickness.
-
Chemical contaminants from indoor/outdoor sources, In everyday life, we don’t really consider that every paint, adhesive, carpet,copy machine, pesticide and cleaning agent brings a whole host of chemicals into our spaces and unfortunately we breathe these every day. Toxins emitted from these products include mainly volatile organic compounds (VOCs) which as we mentioned before are very harmful to our health.
-
Biological contaminants. Most common biological contaminants are bacteria, moulds, pollen and viruses. These elements may act in combination and may supplement other complaints, such as inadequate temperature, humidity, or lighting.
Solutions to SBS
Solutions to sick building syndrome usually include combinations of the following:
-
Pollutant source removal or modification,
-
Increasing ventilation rates, respecting ventilation standards in local building codes.
-
Air cleaning,
-
Education and communication, work more effectively with occupants to prevent problems from occurring.
4. Normative framework of IAQ
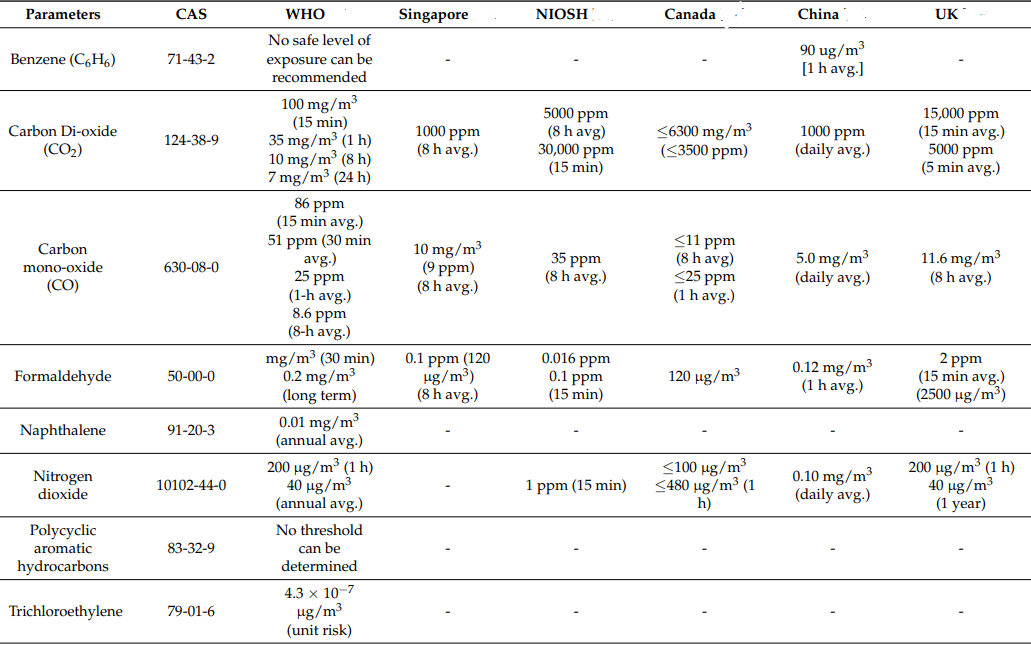
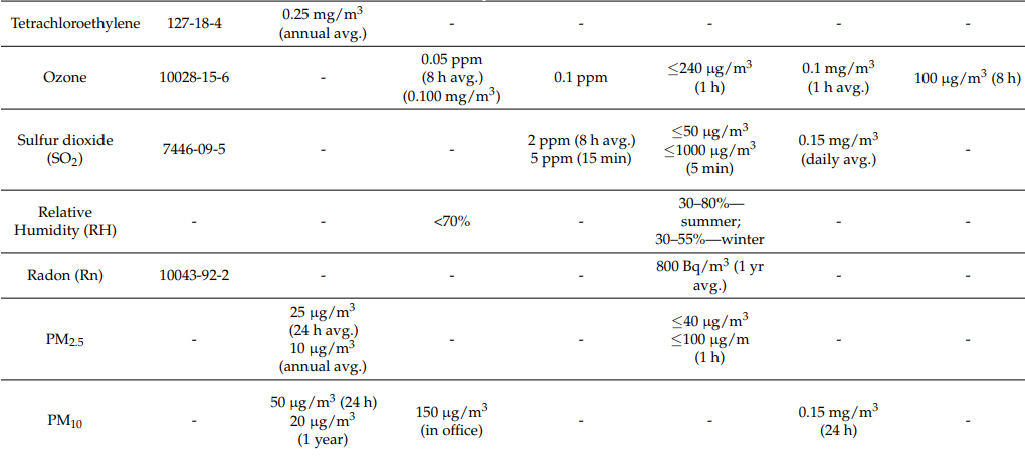
As we mentioned, the quality of indoor air is crucial because people spend a significant portion of their time in different indoor spaces and also because of the presence of numerous pollution sources in indoor spaces, such as traditional and newly developed building materials, finishing products, furniture, cooking systems, and cleaning agents. Therefore, several international organisations worldwide, such as the WHO [WHO2010], have set guidelines and threshold values to maintain an optimal IAQ(Table 2). Apart from the WHO, the most recognized organizations involved in IAQ regulations include the Singapore Public Health Ministry of the Environment [Singapore1996], The National Institute for Occupational Safety and Health[NIOSH2004], Health Canada [Beaulac2020], State Environment Protection Agency in China [Bai2002], Health and Safety Executive of UK [HSE2011] etc.
|
|
About France
When we start to take measurements in the air in a place, it is often aimed to get an idea of the risk for its occupants. This is why it is essential to consider before even launching the measurements, the risks we are interested in and the values we are going to compare the results to get an idea of the risk.
We are going to introduce different benchmark values established in France for the most commonly measured pollutants of indoor air [MSS2010].
Currently, in France there is regulatory management values for radon, asbestos and \(CO\) (Table 3). Those values were set by the government.
Substance |
Regulatory Management Values |
Management actions to engage |
Radon |
\(<400 Bq/m^3\) |
The situation does not justify a special corrective action. |
\(between~~400~~and~~1000 Bq/m^3 \) |
It is desirable to take simple corrective measures. |
|
\(>1000 Bq/m^3 \) |
Corrective actions, must be conducted at short notice, because we are approaching a level of risk which may be significant. |
|
\(CO\) |
\(between~~10~~and~~50 ppm \) |
The situation is estimated unacceptable and the user must be informed that additional investigations concerning the draft of smoke flue and the ventilation of the room are required. |
\(\geq 50 ppm \) |
The situation highlights evidence of serious and immediate danger. |
|
Asbestos |
5 fibre/litre |
Management threshold value requires some work on certain materials. |
They also propose provisional management values for others substances(Table 4), mostly recommended by the High Council for Public Health (HCSP).
Substance |
Provisional Management |
Values |
Benchmark Value |
Value of fast action |
|
From Outdoor sources |
||
Benzene |
\( <2 \mu g/m^3\) |
\( 10 \mu g/m^3\) |
Ozone |
\(110 \mu g/m^3\) |
\(240 \mu g/m^3\) |
From Indoor sources |
||
Tetrachloroethylene |
\(250 \mu g/m^3\) |
\( 1250 \mu g/m^3\) |
Formaldehyde |
\(30 \mu g/m^3\) |
\(100 \mu g/m^3\) |
Toluene |
- |
\( 300 \mu g/m^3\) |
Xylene |
- |
\(200 \mu g/m^3\) |
Trimethylbenzene |
- |
\(1000 \mu g/m^3\) |
1,4-Dichlorobenzene |
- |
\(100 \mu g/m^3\) |
Ethylbenzene |
- |
\(1000 \mu g/m^3\) |
n-Butyl Acetate |
- |
\(5000 \mu g/m^3\) |
2-Butoxyethanol |
- |
\(1000 \mu g/m^3\) |
Styrene |
- |
\(250 \mu g/m^3\) |
5. IAQ index
Air quality index is a measure of air quality, allowing different data to be synthesised into a single value. An increasing number of cities around the world are monitoring the state of their air and publishing an air quality index which mainly fulfills three functions: air quality assessment, decision support, and communication to the public. In mid-2014, the WHO published a database listing the exposure of populations to fine particles, and in 2015, a "Global Air Quality Index" was created, resulting from a social initiative launched in 2007.
IAQ[Piasecki2020] index refers to the building’s indoor air quality evaluation considering the occupant’s satisfaction level presented in 0–100% scale (as a percentage of users satisfied). The percentage of satisfied users is determined by the means of the indoor measured parameters and their specific sensory models implemented.
The authors use the ΣIAQ function(see below) enabling the aggregation of indoor air quality sub-elements to determine the overall satisfaction of users with air quality. Four main elements of indoor air quality are included: total volatile organic compound (TVOC), formaldehyde HCHO, carbon dioxide \(\text{CO}_2\), and fungal spores concentrations in the indoor air (FCU). These IAQ elements reflect the level of indoor pollution with the source of emissions from construction products, external air infiltration and biogenic pollution.
The ΣIAQ model, in which the authors are looking for objective weight sub-elements, uses a selected number of indoor air pollutants \((P_{1,...j})\) and their impact on user dissatisfaction (Percentage Dissatisfied as \(PD = f(c_j)\) in %) [Kostyrko2020]. The combined \(\sum IAQ_{index}\) (cumulative percentage of satisfied users with indoor air quality, including selected pollutant impacts of user perception) equation is
where sub-indices \(\sum IAQ_{P_j}\) are the percentage of users satisfied with the pollutant concentration and \(W(P1, ...P_j)\) are weights for each IAQ sub-component for groups of air pollutants with comparable concentrations.
In this paper, the weights of the ΣIAQ elements were determined in accordance with the multi attribute decision making (MADM) method. The equation for ΣIEQ takes the specific form where the contamination is a high impact element:
For the first considered element of IAQ model \((CO_2)\), a formula of \(PD = f(c_{CO_2})\) is used based on the experimental dependence:
where \(\Delta C_{CO_2}\) is carbon dioxide concentration (ppm) above the outdoor level (a reference value of 350 ppm is recommended if not measured).
A function \(PD = f(c_{TVOC})\) is applied to the IAQ, where a high level of VOCs may be detected (for example where new materials are used). The authors provided function of TVOC concentration \(C_{TVOC} (\mu g/m^3)\) concerning the percentage of dissatisfaction that is implemented in the analyzed case study building:
The third included element considered in the IAQ index is a formaldehyde HCHO indoor air concentration. The authors proposed the equation of \(PD = f(c_{HCHO})\) and implement it as well:
where \(c_{HCHO}\) is HCHO indoor air concentration in \(mg/m^3\).
The last considered element of the IAQ assessment is the indoor air contamination by the considered pollutant. The authors developed a logarithmic regression of user dissatisfaction (PD) based on the recommended values from several resources and obtained the following formula:
where \(C_{FCU}\) is indoor air pollutant concentration in \(FCU/m^3\).
6. Recommendations and tools to enhance IAQ
Moreover, according to EPA (Environmental Protection Agency), degraded Indoor Air Quality is one of the top 5 most urgent environmental risks to public health.
Therefore, modelling the IAQ is a very crucial preventive process. Health problems due to IAQ, which are more commonly respiratory-related diseases and allergies, have increased the importance of IAQ measuring techniques and associated tools.
Some major recommendations are:
-
to eliminate individual sources of pollution or to reduce their emissions.
-
to increase the amount of outdoor air coming indoors.
-
air cleaners collecting pollutants from indoor air.
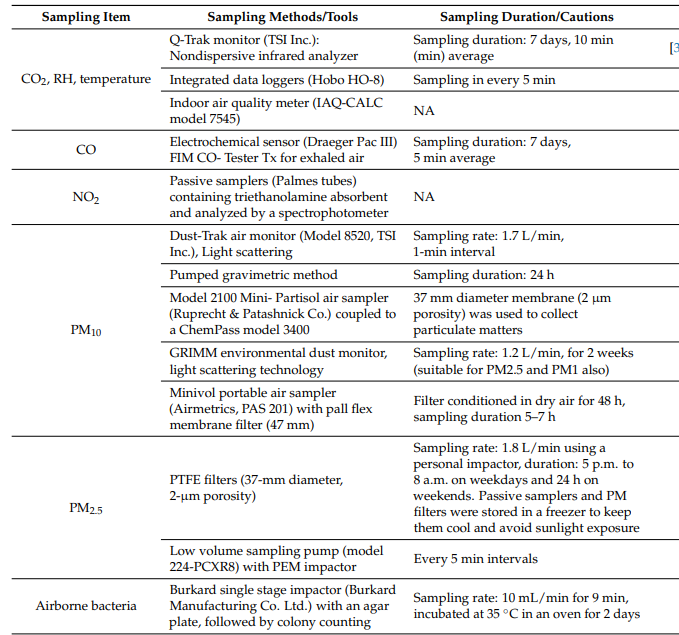
Device types and monitoring systems of different indoor air pollutants were extensively reviewed. This gives reassurance about the quality of breathing air and help in decision making about the renewal of indoor air in buildings, to reduce the risk posed by pollution parameters on people’s health and welfare. Table 5 shows some identified indoor pollutants and devices used for pollutant detection.
|
Most of the developed countries consider and follow IAQ regulations during the design and maintenance phase of building environments through appropriate measures. However, this scenario is not similar in developing or underdeveloped countries, where poor IAQ disproportionately affects children, women, and elderly persons. Despite the severe impact of exposure to indoor air pollutants, there is still a lack of proper scientific research on IAQ in most developing and underdeveloped countries/regions [Mannan_Al-Ghambi2021].
7. Modeling Indoor Air Quality
Indoor air quality (IAQ) models are used to predict the pollutant concentrations both spatially and as a function of time within the building environment. They are divided into 3 categories: statistical, mass balance and computational fluid dynamics (CFD) models [GUO2017].
The statistical models are based on empirical functions that are defined using measuring. Many of them were used to estimate the distribution of indoor pollutant exposures and potential distributions for whole populations or sensitive sub-populations using Monte Carlo techniques to combine the databases.
The mass balance models are based on the principle of mass conservation. They can predict well indoor pollutant concentrations under a wide range of conditions and allow rapid analysis of IAQ control options. They were designed to estimate the impacts of sources, sinks and IAQ control options on indoor pollutant concentrations.
In recent years there has been extensive activities in the development and use of Computational Fluid Dynamics (CFD) software and special programs for room air movement and contaminant transport applications. These investigations range from the prediction of air jet diffusion, air velocity and temperature distribution in rooms, spread of contamination in enclosures, to fire and smoke spread inside buildings. However, numerical modelling of ventilation and associated interior contaminant transport is still at an early stage of development and confidence level.
We are going to introduce the full form of the set of governing equations which once simplified can be used to provide quick, reasonable estimates in IAQ modelling. We are relying on the book called "Modeling Indoor Air pollution" [Pepper_Carrington2009].
The underlying physics associated with indoor air pollution and ventilation resides in the governing equations for fluid motion, heat transfer, and species transport. These equations stem from the time dependent form of the general partial differential transport equation which describes the flow of fluid, heat, and concentration are all based on the conservation of mass, momentum, thermal energy, and species concentration. The dependent variables are the velocity components, temperature, concentration, and some turbulence variables to account for turbulent flow. These governing equations are generally written in the following form:
Conservation of Mass
Conservation of Momentum
Conservation of Energie
Species Concentration
Obtaining solutions to these equations are difficult, generally requiring a numerical approach (CFD). There are instances when one can make simple assumptions regarding overall fluid motion and the solutions are fairly accurate. These assumptions are based on the premise of the flow being ideal, or that the flow is
-
incompressible,
-
inviscid,
-
irrotational.
Hence, we can obtain simplified models that can quickly give solutions describing the general dispersive effects of the spread of contaminants.
ADR equation
Advection-Diffusion-Reaction equation (ADR) is one of the most important and very frequently used mathematical models in science and engineering. It is a partial differential equation that can be derived using the physical laws of mass conservation as well as the mean value theorems of calculus. Advection refers to the movement of a substance due to flow of the water or air. Diffusion accounts for the movement of substance from high to low concentration areas so as to distribute the substance uniformly in the medium. A chemical reaction is a process leading to the inter conversion of chemical substances. ADR equation is a mathematical model that describes how the concentration of one or more pollutants distributed in a medium or river changes under the influence of these three processes. This equation can be used to model a wide range of natural phenomenon and explain their dynamics with respect to time. The application of the general advection-diffusion-reaction equations are wide and numerous. For instance, they are used to formulate pollutant transport models in scientific disciplines.
Indoor air quality can be modelled by using an ADR equation. The governing equation for the concentration of infectious airborne particles has the following formula:
The second term from left is advection term and the third one is diffusion term.
References
-
[Ezzati2002] M. Ezzati , DM. Kammen. The health impacts of exposure to indoor air pollution from solid fuels in developing countries: knowledge, gaps, and data needs. Environ. Health Perspect. November 2002. 110 (11): 1057–68.
-
[Jones1999] A.P. Jones, Indoor air quality and health, Atmospheric Environment, Volume 33, Issue 28,1999,Pages 4535-4564,ISSN 1352-2310.
-
[EPA1991] United States, Environmental Protection Agency, Research and Development, Indoor Air Facts No. 4 Sick Building Syndrome,February 1991 .
-
[WHO2010] WHO. New Guidelines for Selected Indoor Chemicals Establish Targets at Which Health Risks are Significantly Reduced,2010.
-
[Singapore1996] Singapore Public Health Ministry of the Environment. Guidelines for Good Indoor Air Quality in Office Premises; Institute of Environmental Epidemiology; Ministry of the Environment: Singapore, 1996; pp. 1–47.
-
[NIOSH2004] NIOSH, NIOSH Pocket Guide to Chemical Hazards, 2004.
-
[Beaulac2020] Vanessa J. Beaulac, Health Canada’s Approach to Indoor Air Contaminants,2020.
-
[Bai2002] Z. Bai, C. Jia, T. Zhu and J. Zhang. Indoor Air Quality Related Standards in China. Proc. Indoor Air 2002, 1012–1017.
-
[MSS2010] Ministère de la santé et des sports, Gestion de la qualité de l’air intérieur, Guide pratique 2010.
-
[HSE2011] Health and Safety Executive. EH40/2005 Workplace Exposure Limits. 2011.
-
[Mannan_Al-Ghambi2021] M. Mannan, S. G. Al-Ghamdi. Indoor Air Quality in Buildings: A Comprehensive Review on the Factors Influencing Air Pollution in Residential and Commercial Structure. Int. J. Environ. Res. Public Health 2021, 18, 3276.
-
[GUO2017] F. Guo. Development of a model for controlling indoor air quality. Earth Sciences. University of Strasbourg, 2017.
-
[Pepper2009] D. W Pepper, D. Carrington. Modeling Indoor Air Pollution,2009.
-
[Kostyrko2020]M. Piasecki, K. Kostyrko. Development of Weighting Scheme for Indoor Air Quality Model Using a Multi-Attribute Decision Making. Energies 2020, 13, 3120.
-
[Wikipedia2021]. Transmission of COVID-19. Wikipedia,2021.
-
[Morawska2020] L. Morawska, J. W. Tang, W. Bahnfleth, P. M. Bluyssen, A. Boerstra, G. Buonanno, J. Cao, S. Dancer, A. Floto, F. Franchimon, C. Haworth, J. Hogeling, C. Isaxon, J. L. Jimenez, J. Kurnitski, Y. Li, M. Loomans, G. Marks, L. C. Marr, L. Mazzarella, A. K. Melikov, S. Miller, D. K. Milton, W. Nazaroff, P. V. Nielsen, C. Noakes, J. Peccia, X. Querol, C. Sekhar, O. Seppänen, S. Tanabe, R. Tellier, K. W. Tham, P. Wargocki, A. Wierzbicka, M. Yao, How can airborne transmission of COVID-19 indoors be minimised?, Environment International,Volume 142,2020,105832,ISSN 0160-4120.
-
[Alonso2021] A. Alonso,J. Llanos, R. Escandón, J.J. Sendra. Effects of the COVID-19 Pandemic on Indoor Air Quality and Thermal Comfort of Primary Schools in Winter in a Mediterranean Climate. Sustainability 2021, 13, 2699.
-
[Giordano2020] G. Giordano, F. Blanchini, R. Bruno, P. Colaneri, A. Di Filippo ,A. Di Matteo and M. Colaneri. Modelling the COVID-19 epidemic and implementation of population-wide interventions in Italy, Nat Med 26, 855–860 (2020).
-
[Lau2021] Z. Lau, K. Kaouri, I. M. Griffiths, A. English. Predicting the Spatially Varying Infection Risk in Indoor Spaces Using an Efficient Airborne Transmission Model, 18th May 2021.
-
[Piasecki2020] Piasecki, Michał & Radziszewska-Zielina, Elżbieta & Czerski, Piotr & Fedorczak-Cisak, Małgorzata & Zielina, Michał & Krzyściak, Paweł & Kwaśniewska-Sip, Patrycja & Grześkowiak, Wojciech. (2020). Implementation of the Indoor Environmental Quality (IEQ) Model for the Assessment of a Retrofitted Historical Masonry Building. Energies. 13. 6051. 10.3390/en13226051.