Pulse simulations
As a first step, we are making a basic standard simulation using Pulse. Our case includes the standard male patient (included in the Pulse library), located in the stantard environment (also included in Pulse).
Then, we make a second simulation with the same patient, but in a different environment, to see how a human react according to his surroundings.
The following simulation includes a patient with a specific condition, in a standard environment, and in the different environment we simulated in the previous step.
We decide to study the following parameters:
-
heart rate (1/min): the speed at which the heart beats. It should be between 60 and 100.
-
arterial pressure (mmHg): the force of circulating blood on the walls of the arteries. This parameter gives the current arterial pressure.
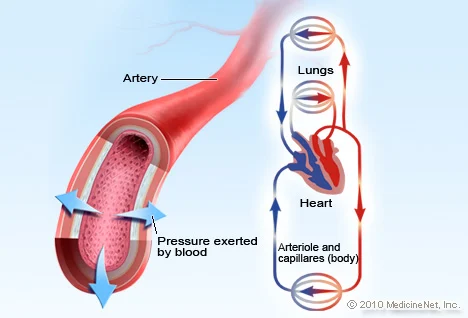
-
Arterial pressure is taken using two measurements: systolic (measured when the heart beats, when blood pressure is at its highest) and diastolic (measured between heart beats, when blood pressure is at its lowest).
-
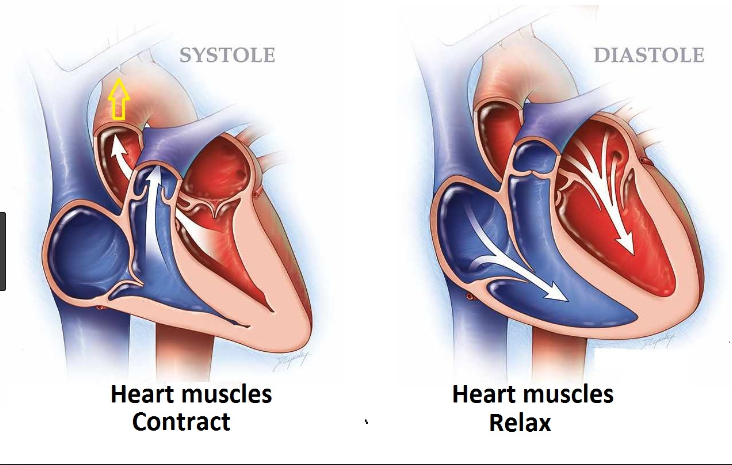
systolic arterial pressure (mmHg): maximum pressure within the large arteries when the heart muscle contracts to propel blood through the body (between 90 and below 120).
-
diastolic arterial pressure (mmHg): lowest pressure within the large arteries during heart muscle relaxation between beating (between 60 and below 80).
-
-
mean arterial pressure (mmHg): average arterial pressure throughout one cardiac cycle, systole, and diastole.
-
end tidal carbon dioxide fraction: the fraction of gas in the mouth/nose that is carbon dioxide at the end of each respiratory cycle (between 5 and 6%).
-
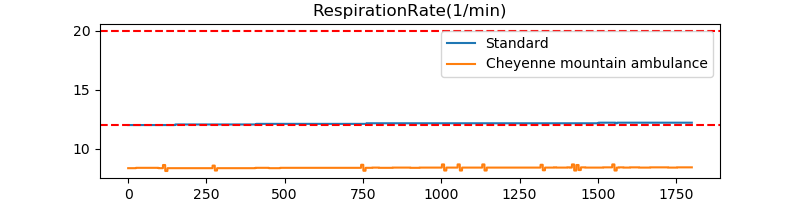
respiration rate (1/min): number of breaths a person takes per minute (12–20 breaths per minute).
-
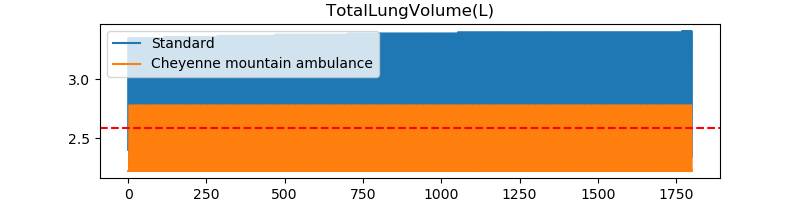
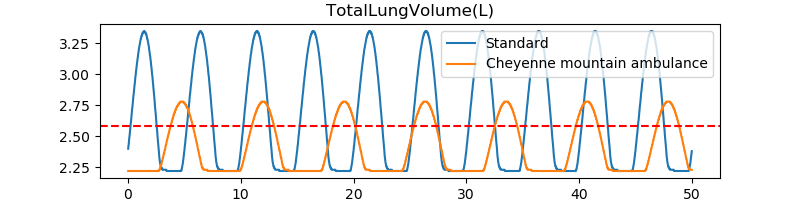
total lung volume (L): volume of gas in the lungs.
-
skin temperature (degC): temperature of the outermost surface of the body (between 33.5 and 36.9°C).
-
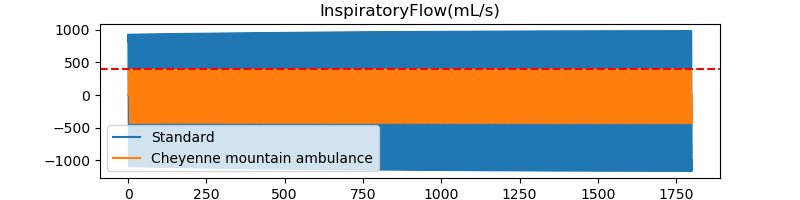
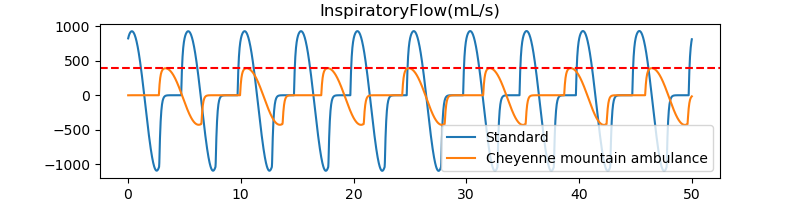
inspiratory flow (mL/s): Instantaneous airflow into the lungs (negative value when exhaling).
-
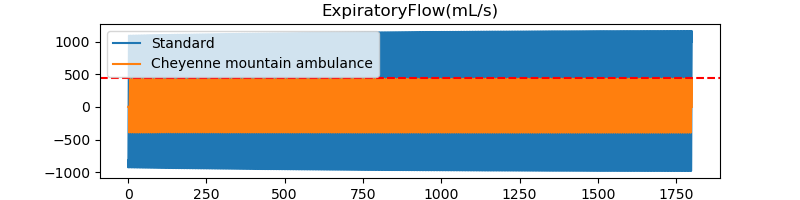
expiratory flow (mL/s): Instantaneous airflow out of the lungs (negative value when inhaling).
1. Standard male patient
The standard male patient included in the Pulse library has the followings characteristics:
-
Age: 44
-
Weight: 170 lb (77.11 kg)
-
Height: 71 inches (1.80 m)
-
Body fat percentage: 0.21
-
Diastolic arterial pressure: 73.5 mmHg
-
Systolic arterial pressure: 114.0 mmHg
-
Heart rate: 72.0 /min
-
Respiration rate: 12.0 /min.
2. Standard environment
The standard environment has the following features:
-
Air velocity: 0.1 m/s
-
Ambient temperature: 22.0 degree Celsius
-
Atmospheric pressure: 760.0 mmHg
-
Clothing resistance: 0.5 clo
-
Emissivity: 0.95
-
Mean radiant temperature: 22.0 degree Celsius
-
Relative humidity: 0.6
-
Respiration ambient temperature: 22.0 degree Celsius
-
AmbientGas:
-
Nitrogen: 0.75
-
Oxygen: 0.21
-
CarbonDioxide: 4.0E-2
-
3. Change of environment
We made two distincts simulations using the same patient (the one described before), but changing the environment. In the first case, we took the standard environment, while in the second, we used the "Cheyenne Mountain Ambulance" environment. Here are the differences:
Standard environment |
Cheyenne mountain ambulance |
|
Air velocity |
0.1 |
no specified value |
Atmospheric pressure |
760.0 |
542.0 |
Emissivity |
0.95 |
0.9 |
Relative humidity |
0.6 |
0.5 |
Nitrogen |
0.75 |
0.7901 |
Oxygen |
0.21 |
0.2095 |
Carbon dioxide |
4.0E-2 |
4.0E-4 |
Thanks to the ambient temperature and the atmospheric pressure, we can calculate the altitude of our environment. The standard environment is at 0 m of altitude, while the "Cheyenne Mountain Ambulance" environment is at approximately 2828 m of altitude.
We obtain the following graphics that allow us to see the differences due to the environment change.
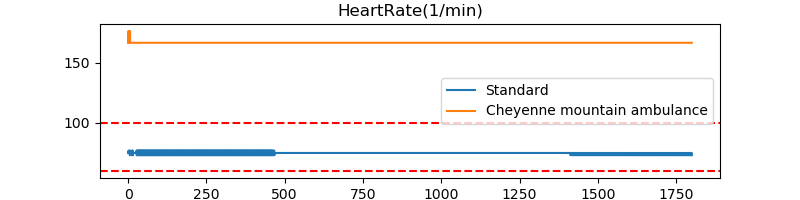
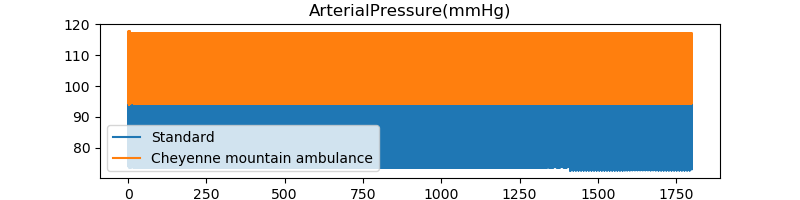
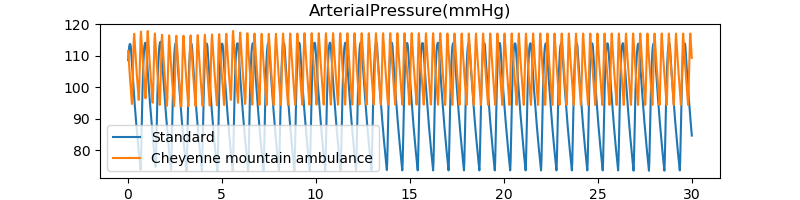
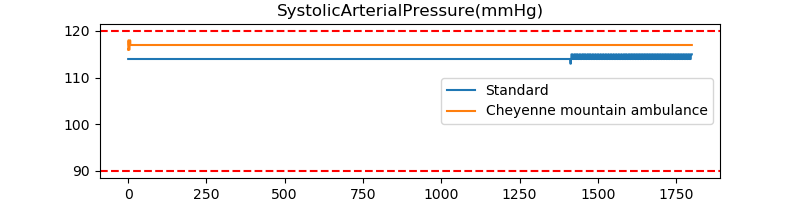
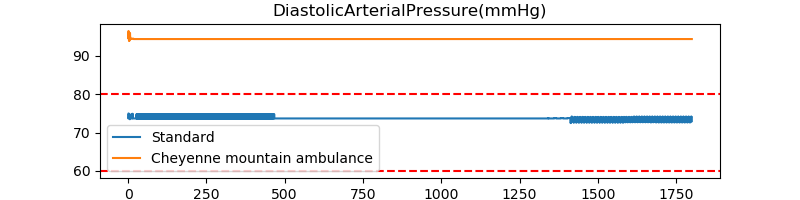
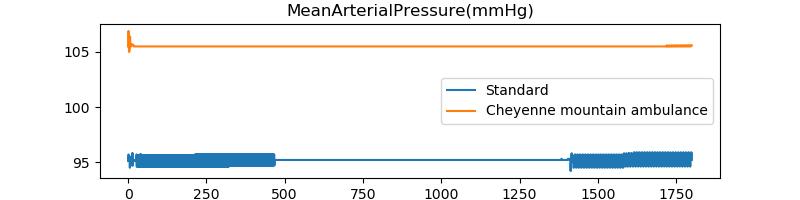
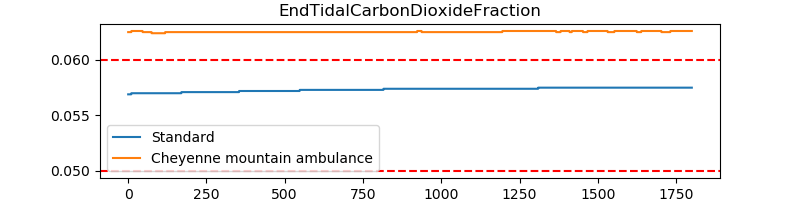
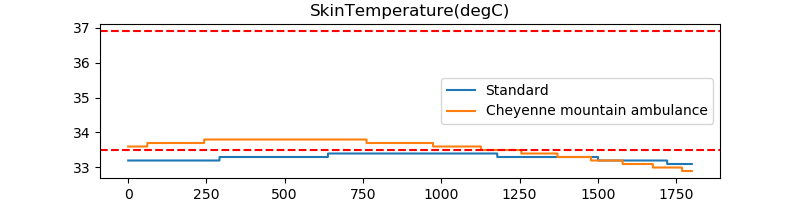
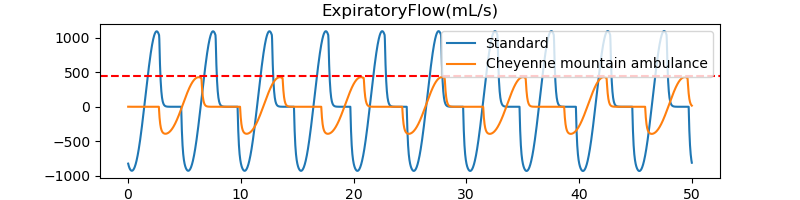
This first comparison shows us the importance of our living environment. It indeed impacts our organism. However, in this illustration, we did not define which component.s in particular affect us (all of them?), because we made several changes in the environment settings.
However, the main difference between the two environments taken into account is the atmospheric pressure. It lets us think it plays a major role in the observed differences.
We decide to compare our results with common observations made in high altitude.
In high altitude:
Expected |
Realised |
|
increases |
OK |
|
increases |
OK |
|
increases |
OK |
|
increases |
OK |
|
mean arterial pressure |
increases |
OK |
increases |
OK |
|
increases |
NOT OK |
|
reduces |
OK |
|
slight rise on arrival at altitude and thereafter a gradual fall |
OK |
|
breathes faster and more deeply |
NOT OK |
Most of the expected conditions were realised, except for the respiration rate, the inspiratory and expiratory flow. While arriving at high altitude, an acclimatisation process takes place. We can assume it takes more than 30 minutes (time of our simulation) to take place, and this is the reason we are not able to see the changes in our results.
Moreover, the Pulse standard patient placed in high altitude suffers from hypoxia. This shoud results in fast heartbeats, which is not the case in our simulation.
4. Patient with a condition
Now, we compare our standard patient with a patient that has a medical condition. The medical condition choosen here is a mild severity chronic anemia. We obtain the following graphics:
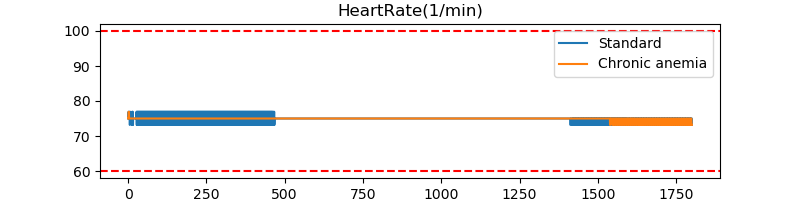
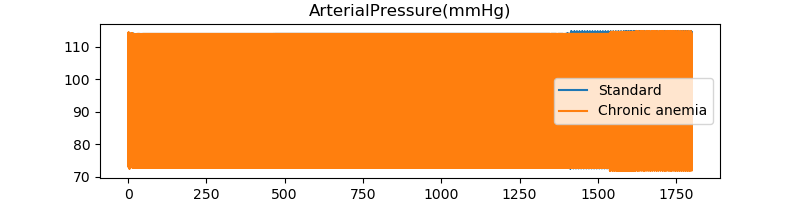
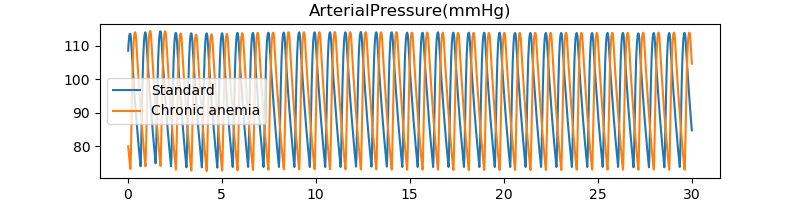
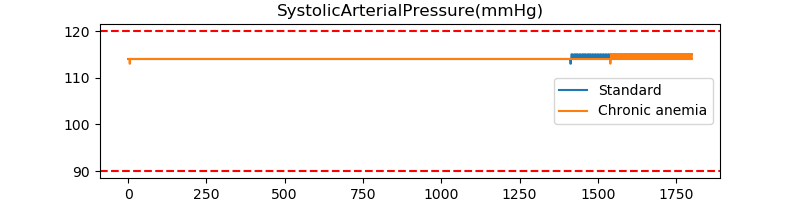
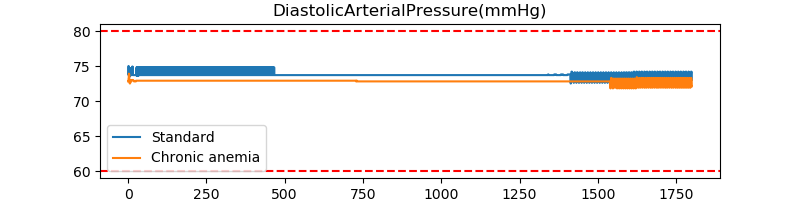
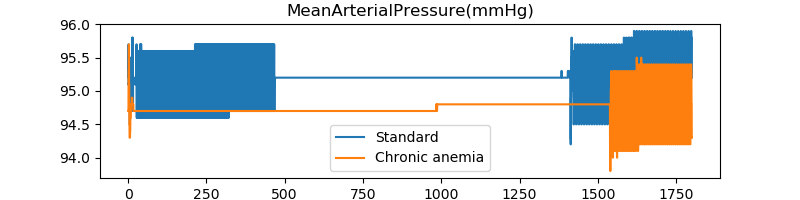
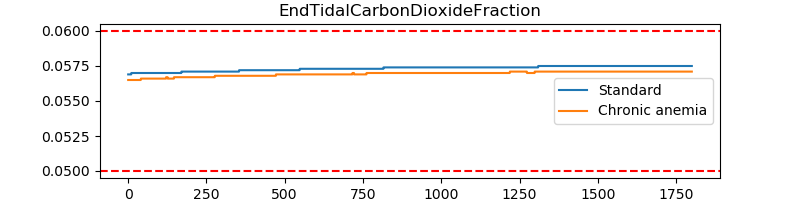
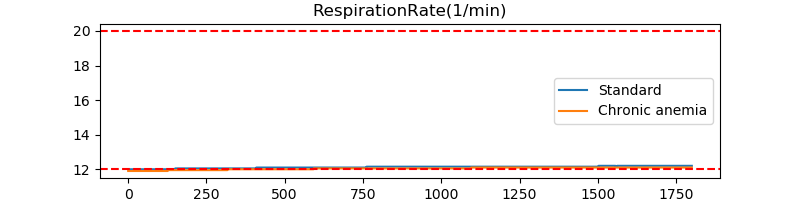
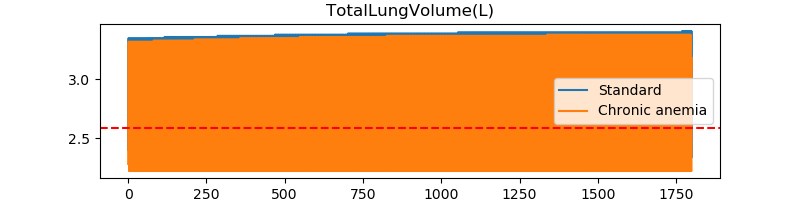
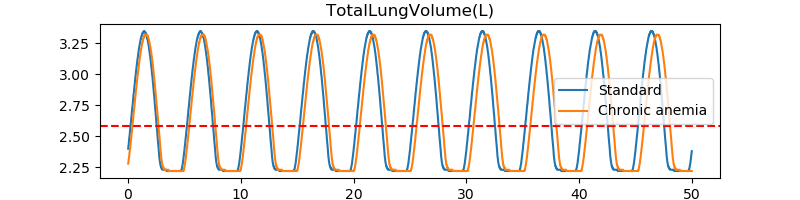
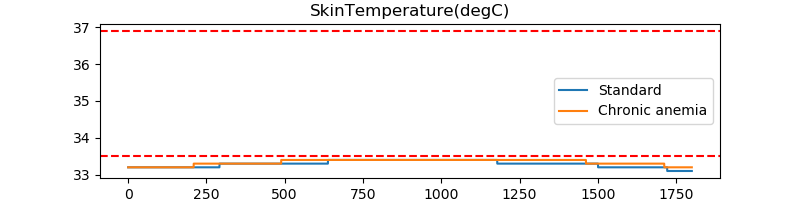
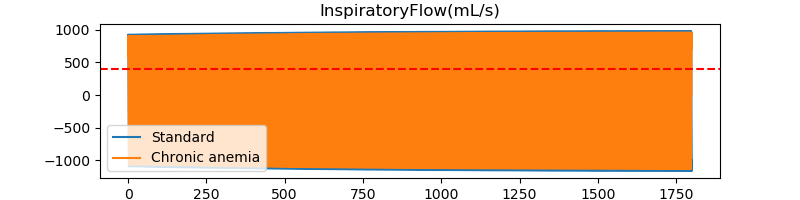
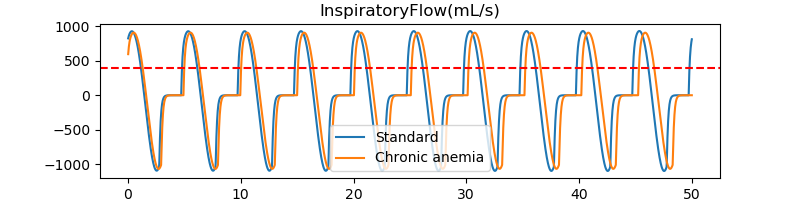
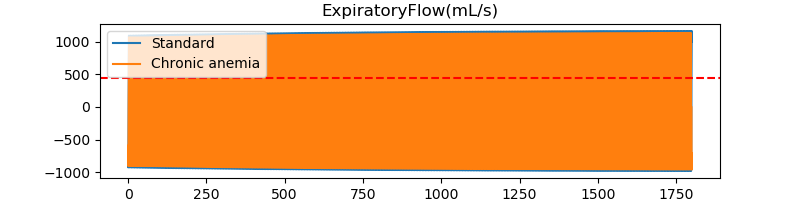
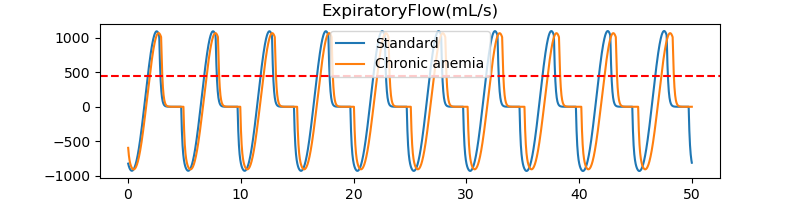
We can also compare our previous results with a patient suffering from chronic anemia, in the "Cheyenne Mountain Ambulance" environment.
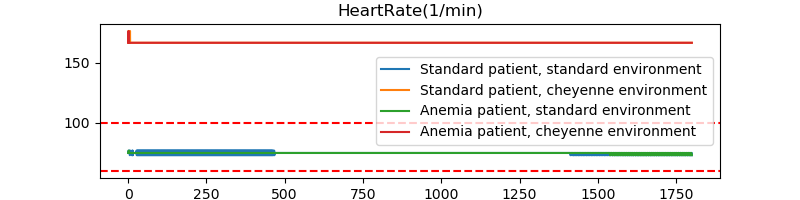
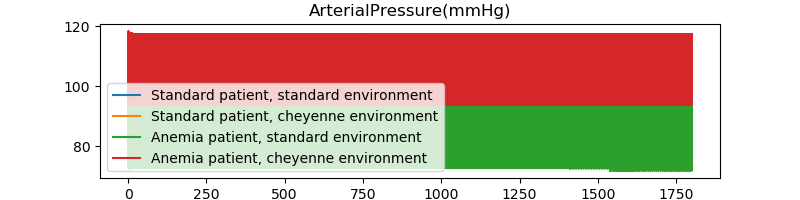
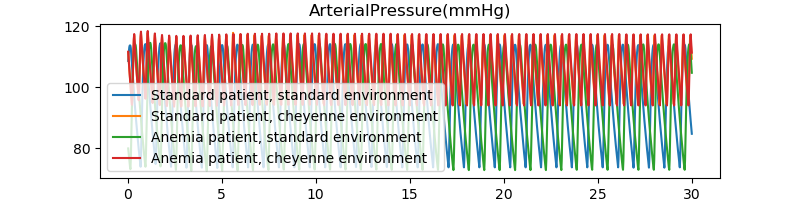
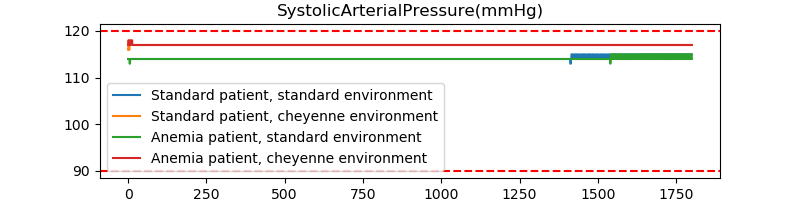
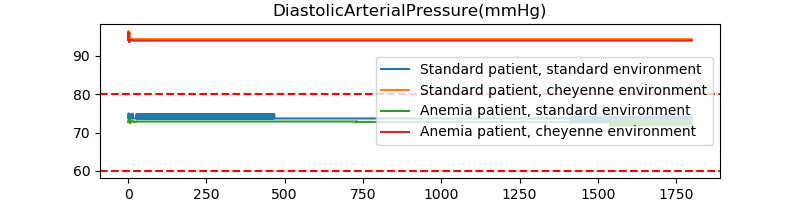
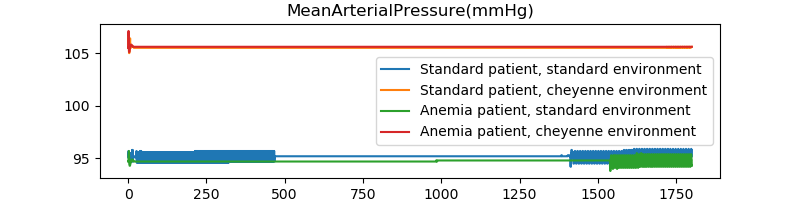
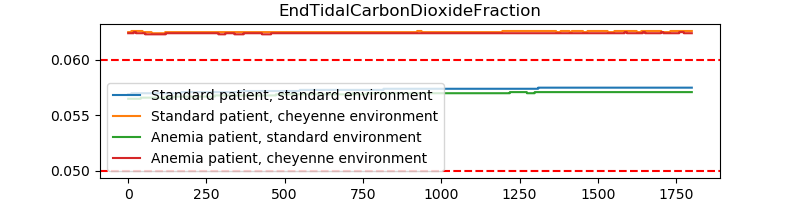
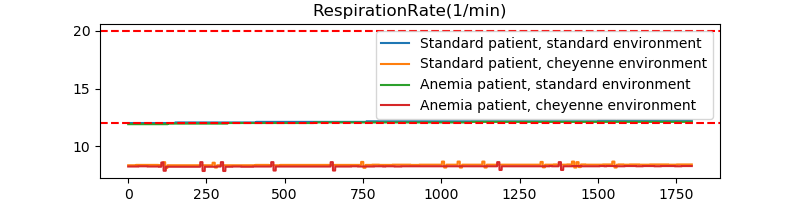
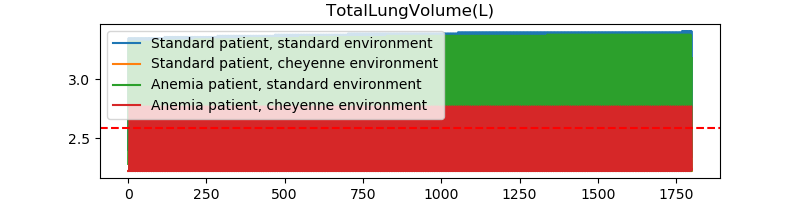
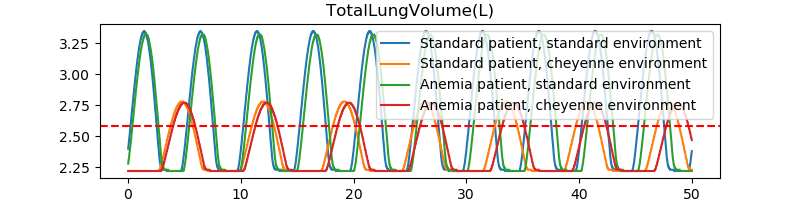
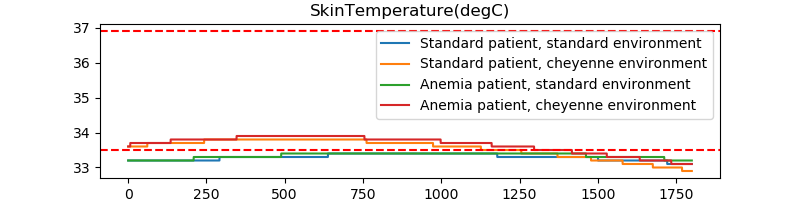
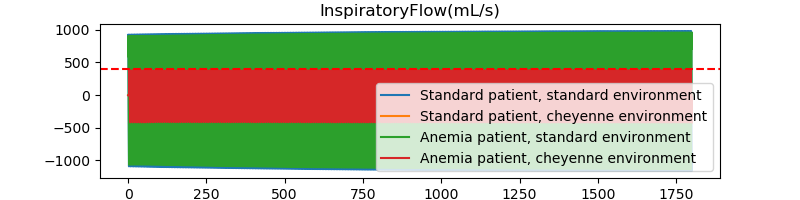
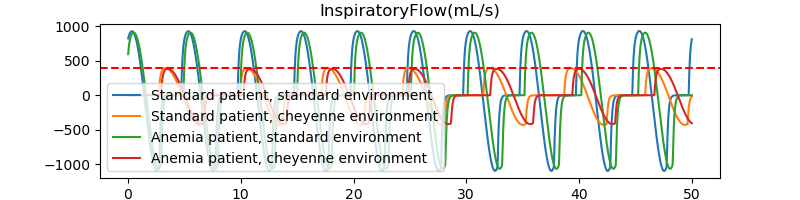
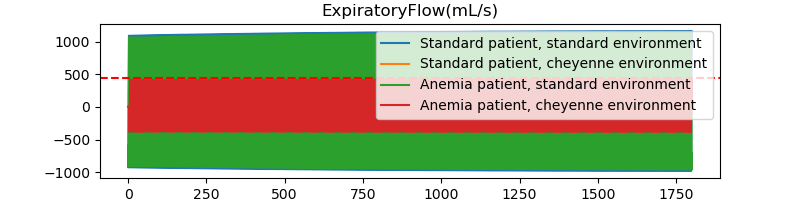
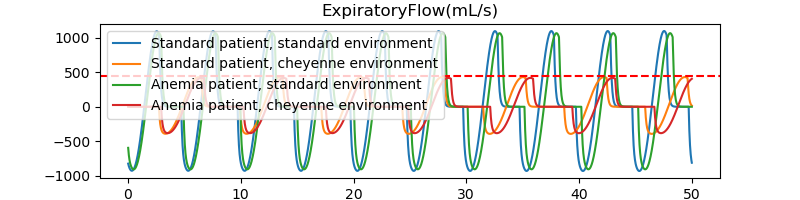
In our case, we can notice the standard patient in a standard environment has its values close to the patient with chronic anemia in the same environment. Also, the standard patient in the cheyenne mountain environment has similar values that the patient with chronic anemia in the same environment. Here, the environment plays a major role in the simulations.
References
-
[CO2] Rebecca Lindsey Climate Change: Atmospheric Carbon Dioxide August 14, 2020
-
[C02_emissions] STEPHANIE OSMANSKI How Do Carbon Emissions Affect the Environment? MAR. 30 2020
-
[energy_in_buildings] Why are household energy efficiency measures important for tackling climate change? 5 June, 2018
-
[Ibat] Christophe Prudhomme 4fastsim-ibat OCTOBER 21, 2019
-
[IAQ] Indoor Air Quality
-
[IAQ_covid] Indoor Air and Coronavirus
-
[pulse] Pulse
-
[Respiratory_Methodology] Pulse respiratory
-
[low_airway] Cambridge University Press The Lower Airways 2019
-
[dead_space] Dead space and its components
-
[respiration] Respiration
-
[normal_pulse] Pulse & Heart Rate
-
[blood_pressure] Blood pressure
-
[med_ill] Medical illustration
-
[end_tidal_carbon_dioxide] End-Tidal CO2 May 2018
-
[lung_vol] Lung volumes
-
[skin_temp] Skin temperature
-
[rep_sys_list] Respiratory System List
-
[altitude_hr] Elevated Thinking: Altitude and the Heart Mar 30, 2012
-
[lung_ha] The lung at high altitude
-
[everest_ha] Robert Preidt Everest Study Finds High Altitude Affects BP Aug. 27, 2014
-
[thin_air] Living in thin air
-
[body_temp] Body temperature
-
[covid_mask] Mask
-
[ventilator] Jeffrey B. Webb ,Aaron Bray,Philip K. Asare,Rachel B. Clipp,Yatin B. Mehta,Sudheer Penupolu,Aalpen A. Patel,S. Mark Poler Computational simulation to assess patient safety of uncompensated COVID-19 two-patient ventilator sharing using the Pulse Physiology Engine November 25, 2020